Compare React App Performance Snapshots with Reactime
September 13, 2021 | 5 minutesIn This Post
Measuring performance implications as you iterate on a React application can be tricky. While you can take performance snapshots in Chrome Developer Tools, these snapshots analyze performance for your entire webpage and can't drill into the specifics of your React components. They also aren't easy to compare. The React Profiler (part of the React Developer Tools) lets you analyze component performance, but doesn't have an easy way to compare profiles (as far as I'm aware).
While trying to debug a performance issue, I came across the Reactime Chrome browser extension and found it helpful as I worked on improving a few components. It's a tool for specifically analyzing React component performance that enables you to compare snapshots over time and verify that your changes actually are improving performance. Let's take a closer look!
Getting Started with Reactime
It's pretty easy to get started with Reactime. I will say that I used this on a vanilla React app though. Your mileage may vary if you're using it with NextJS, Gatsby, etc. as the Reactime team is still building out support for these (it looks like it's in beta).
- Make sure that you already have the React Developer Tools extension installed.
- Install the Reactime browser extension from the Chrome Web Store.
- Run a React app locally.
- Right click on the React app in the browser and select Reactime from the context menu. Alternatively, Reactime should be available as a tab in your Chrome Developer Tools.
- If you opened Reactime from the context menu, it should appear in a new window.
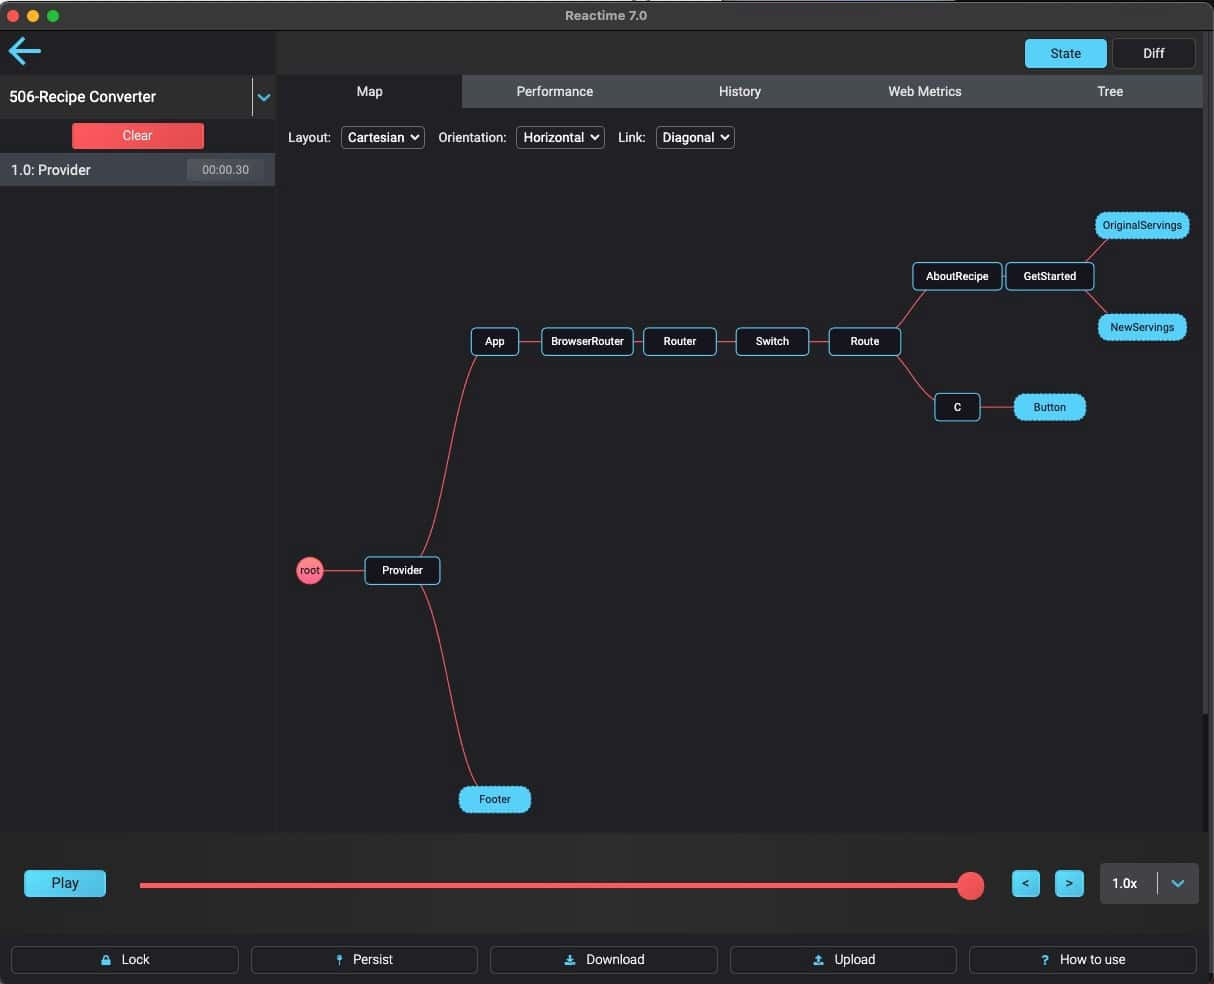
The first thing that you'll see is a map representing the component structure of your app.
Viewing, Saving, and Comparing Performance Snapshots
The performance snapshot for your React components is available on the Performance tab. There are three sub-tabs within the Performance tab: Snapshots View, Comparison View, and Component Details.
Snapshots View
This tab shows the rendering time in milliseconds for each component as a stacked bar chart. Hovering over each color band in the bar chart will show the name of the component that rendered, how long it took, and whether it was stateless. In the top right corner, there's a red "Save Series" button. To save a performance snapshot to use in a comparison later, click the "Save Series" button.
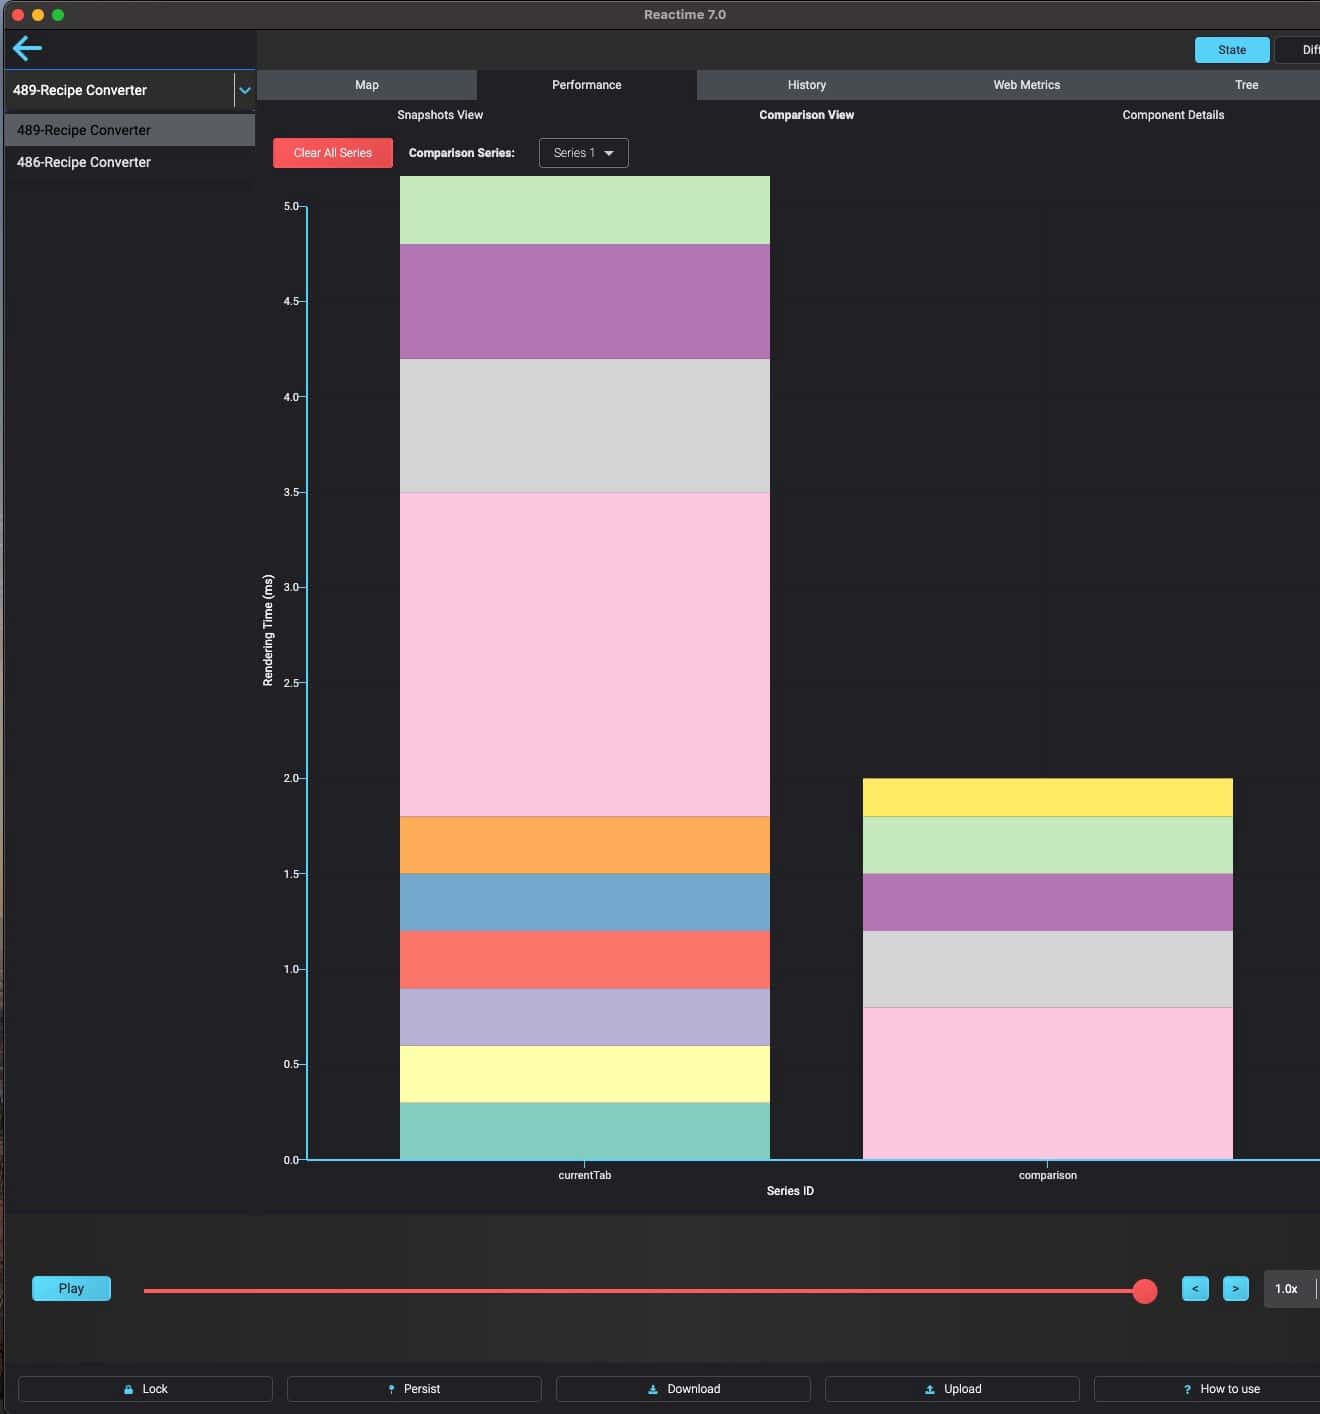
Comparison View
As the name suggests, this tab is used to compare snapshots over time. When you save a snapshot, it becomes part of a series. You can use the "Comparison Series" drop-down menu in the top left corner to select the series that you want to compare.
When you first save a series, the "Series 1" option in the "Comparison Series" drop-down compares the saved series to itself. The best way to use this option is to save another series, which you can do by following these steps:
- Open your React app in another tab.
- Reactime should automatically update to show a new "instance" (in the same window) for your newly opened React app tab. (Note: you can toggle between React apps in Reactime using the drop-down menu in the top far left corner; each app gets a unique ID number added to the beginning of it to make it easier to tell which tab is being referred to.)
- Take the same actions in your app that you did before making the previous snapshot.
- When ready, go to the Performance > Snapshots View tab and click the "Save Series" button.
- Go to the Performance > Comparison View tab now and select "Series 1" from the "Comparison Series" drop-down. This will now compare your previous snapshot with the current one.
Comparing the snapshots can be a little confusing because the series to compare is relative to the currently selected "tab" in Reactime. Series 1 compares the two snapshots in our current configuration because you're still on the Reactime instance for the second tab that you opened. If you were to go back to the first tab in Reactime, you would need to select "Series 2" as the comparison series.
Even after closing both application tabs, reopening a new tab, and opening Reactime again, the saved snapshots are still available. You can compare your current snapshot to both of the series you created above.
Component Details
The Component Details tab shows how many times each component re-renders as you use your app. You can compare the number of re-renders across components to find components that are rendering more often than expected.
Additional Reactime Features
Reactime offers other features as well including a diff tree that represents changes to state; web metrics that measure key performance indicators like largest contentful paint (LCP), first input delay (FID), and time to first byte (TTFB); and a component tree similar to the React Developer Tools Components tab. The tool is still in active development and is open source if you're interested in contributing.
Since it works on locally running apps and is meant for testing changes during development, keep in mind that the performance data shown isn't exactly the same as the performance of your application in production. Apps generally run in "development" mode locally and "production" mode in production. In "development" mode, code is included that provides warnings and tools to help with debugging but is stripped out in "production" mode. The performance data will help you determine if your changes are improving performance, but it's good to keep in mind that the actual performance data in production will likely vary.
Happy debugging!