How to Set Up a Debugger in Cursor for TypeScript Projects
November 11, 2025 | 7 minutesIn This Post
- Step 1: Enable Source Maps in TypeScript
- Step 2: Create a
launch.json - Step 3: Run the Debugger
- Step 4: Adjust Debug Settings in Cursor
- Step 5: Use Cursor’s AI-Enhanced Debugging
- Example: Debugging a Next.js API Route
- How Cursor AI Works with the Debugger
- Key Differences Between Cursor and VS Code
- Troubleshooting Tips
- Final Thoughts
If you're a Javascript developer, you may have never used a debugger in your IDE. It can be really helpful when you want to see what's in memory as you step through your code and trace server-side logic.
Cursor is a popular IDE for JavaScript/TypeScript development with AI built into it. It's built on top of VS Code, so most configurations work the same, but there are a few differences worth noting, especially around breakpoint behavior and AI-driven debugging.

Step 1: Enable Source Maps in TypeScript
If your project uses TypeScript, make sure your compiled JavaScript files include source maps.
In your tsconfig.json, verify the following options:
1{ 2 "compilerOptions": { 3 "target": "ESNext", 4 "module": "commonjs", 5 "outDir": "dist", 6 "sourceMap": true, 7 "inlineSources": true 8 }, 9 "include": ["src/**/*"] 10}
Without source maps, your debugger breakpoints will target the compiled .js files rather than the original .ts sources, which will make it harder to trace your code.
Step 2: Create a launch.json
Cursor supports the same debugging configuration format as VS Code. For debugging server-side code, add a .vscode/launch.json file in your project root with a Node.js debugging setup like this:
1{ 2 "version": "0.2.0", 3 "configurations": [ 4 { 5 "name": "Debug TypeScript (Node)", 6 "type": "node", 7 "request": "launch", 8 "program": "${workspaceFolder}/dist/index.js", 9 "preLaunchTask": "tsc: build - watch", 10 "outFiles": ["${workspaceFolder}/dist/**/*.js"], 11 "sourceMaps": true, 12 "smartStep": true 13 } 14 ] 15}
If you’re building a frontend app with React, Next.js, Vite, or Vanilla JS, you’ll want to use the Chrome debugger instead of Node. To do so, change the configuration in your .vscode/launch.json file to use the "chrome" type. This tells Cursor (and VS Code) to launch a Chrome instance and connect the debugger to it.
1{ 2 "version": "0.2.0", 3 "configurations": [ 4 { 5 "name": "Debug Frontend (Chrome)", 6 "type": "chrome", 7 "request": "launch", 8 "url": "http://localhost:5173", // your local development server 9 "webRoot": "${workspaceFolder}/src", // directory where your original source files live 10 "sourceMaps": true, 11 "skipFiles": ["<node_internals>/**"] 12 } 13 ] 14}
Step 3: Run the Debugger
Set a breakpoint in one of your .ts or .js files, then press the F5 key or use the "Run > Start Debugging" command to launch the debugger.
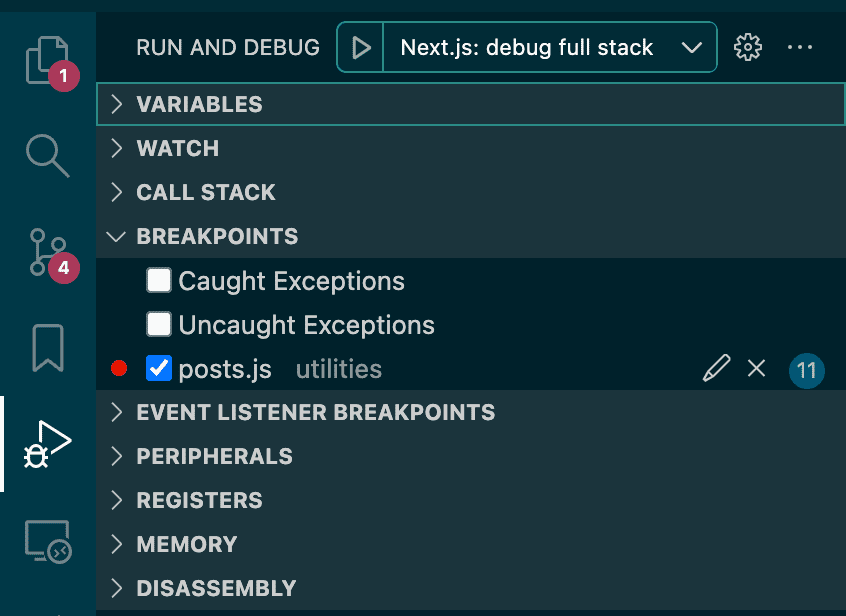
You can see your breakpoints, the call stack, and the variables in the current scope in the "Run and Debug" tab in the left control panel within Cursor.
If you’re running a script manually, you can also attach the debugger to a running process with the command below:
1node --inspect-brk dist/index.js
You'll then be able to attach the debugger using the "Attach to Node Process" configuration.
Step 4: Adjust Debug Settings in Cursor
Some users report that breakpoints that work in VS Code don’t always trigger in Cursor out of the box. If that happens, open Settings > Debug: JavaScript Auto Attach Filter and set it to "smart".
This ensures Cursor automatically connects to child processes and picks up your breakpoints correctly.
Step 5: Use Cursor’s AI-Enhanced Debugging
Cursor’s AI integration can analyze stack traces and error messages, then suggest fixes or explain the cause of a crash. This feature doesn’t replace traditional debugging, but it’s useful for quick insights into unfamiliar code paths or subtle async issues.
For example, when a runtime error occurs, you can highlight the stack trace and ask Cursor’s AI to "Explain this error". The AI will then trace the call stack and summarize what went wrong.
Example: Debugging a Next.js API Route
If you’re using Next.js, here’s an example launch.json for debugging API routes:
1{ 2 "version": "0.2.0", 3 "configurations": [ 4 { 5 "name": "Next.js: debug server-side", 6 "type": "node-terminal", 7 "request": "launch", 8 "command": "npm run dev", 9 "serverReadyAction": { 10 "pattern": "- Local:.+(https?://.+)", 11 "uriFormat": "%s", 12 "action": "debugWithChrome" 13 } 14 }, 15 { 16 "name": "Next.js: debug client-side", 17 "type": "chrome", 18 "request": "launch", 19 "url": "http://localhost:3000", 20 "webRoot": "${workspaceFolder}", 21 "sourceMapPathOverrides": { // Only needed if you're using Webpack 22 "webpack://_N_E/./*": "${webRoot}/*", 23 "webpack:///./*": "${webRoot}/*" 24 } 25 }, 26 { 27 "name": "Next.js: debug full stack", 28 "type": "node-terminal", 29 "request": "launch", 30 "command": "npm run dev", 31 "serverReadyAction": { 32 "pattern": "- Local:.+(https?://.+)", 33 "uriFormat": "%s", 34 "action": "debugWithChrome" 35 } 36 } 37 ] 38}
Server-Side Debugging
Set a breakpoint in one of your pages/api/*.ts file, select the "Next.js: debug server-side" debugging profile, and hit the endpoint (e.g., http://localhost:3000/api/hello). Cursor should pause execution at your breakpoint, allowing you to inspect variables just as you would in VS Code.
Client-Side Debugging
Run your local dev server with npm run dev. Then, start the "Next.js: debug client-side" debugging profile. After you load the page you want to debug once, you should be able to set breakpoints in the code.
Full-Stack Debugging
The "Next.js: debug full stack" debugging profile above will let you debug both server-side and client-side code.
How Cursor AI Works with the Debugger
Cursor uses the same debugging engine as VS Code, but layers AI capabilities around the process to help you interpret what’s happening and fix issues faster.
Explaining Runtime Errors and Stack Traces
When an exception appears in your console or terminal, you can highlight it and "Add to Chat" (or CMD/CTRL + L) to ask Cursor to explain it. The AI reads the stack trace, follows the file paths, and summarizes what caused the issue — often pointing to the exact variable or function responsible.
Explaining Code While Paused
When you hit a breakpoint, you can highlight a section of code, add it to the chat (CMD/CTRL + L), and ask questions like:
- "what might cause this to be undefined?"
- "What happens if this branch is executed?""
Cursor analyzes the surrounding code and provides a natural-language explanation based on control flow and type context. It doesn’t access live runtime memory, but gives you an intelligent static analysis that complements step debugging.
Fix Suggestions from Errors
If a logged error or stack frame includes a TypeError or reference issue, you can highlight the error, add it to the chat (CMD/CTRL + L), and ask Cursor to fix it. The AI will navigate to the relevant file and line, then suggest a fix alongisde a rationale for the change.
Limitations
Cursor’s AI currently can’t view live variable memory or manipulate breakpoints directly, but it acts as an intelligent layer on top of the debugger, bridging the gap between stack traces and understanding.
Key Differences Between Cursor and VS Code
While Cursor inherits most of VS Code’s debugging features, there are a few distinctions:
| Feature | Cursor | VS Code |
|---|---|---|
| Base Debugger | Same VS Code engine | Mature, widely supported |
| AI Debugging Assistant | Built-in, can explain and fix errors | Requires external extensions |
| Breakpoint Reliability | Occasionally inconsistent; may need “smart” attach enabled | Generally stable |
| Extension Support | Most VS Code extensions work, but not all | Full compatibility |
| Community Resources | Smaller, newer community | Extensive documentation and examples |
Overall, Cursor’s debugging system is nearly identical to VS Code’s, but its AI layer introduces both new capabilities and a few minor quirks.
Troubleshooting Tips
- Breakpoints aren't bounded (i.e., they aren't red in Cursor)? If you're debugging client-side code, make sure you start your dev server before the debugger and that you load the page you want to debug before adding breakpoints. Loading the page generates the sourcemaps that the debugger needs for binding the breakpoints.
- Breakpoints not hitting? Check that your compiled files have matching
.mapfiles. - Using a monorepo? Adjust the
outFilespath to match each package’s build directory. - If the debugger won’t attach, run your program with
--inspectand attach manually. - Keep your Node.js version consistent with your workspace’s configuration. Mismatched runtimes can cause silent attach failures.
Final Thoughts
Debugging in Cursor feels instantly familiar if you’re coming from VS Code. The configurations are the same, the behavior mostly identical — but with the bonus of an AI assistant that can explain stack traces and suggest code fixes.
While Cursor is still catching up to VS Code's maturity in some areas (like auto-attach reliability), it's already a capable environment for JavaScript and TypeScript development, especially if you value fast feedback and built-in AI context.
If you're working in a monorepo setup, you may also find it helpful to learn about using Turborepo's --affected flag in CI to only run builds and tests on changed packages. And if you're running into test issues alongside debugging, check out how to fix "window.matchMedia is not a function" in Vitest.